Crypto DCA Backtest for Retirement Planning: Weekly vs RSI and MACD
We earmarked $100 a week for Bitcoin and Ethereum, then compared automatic weekly buying with RSI and MACD filters in HeyTraders.

In this story
- Crypto DCA backtest: the question we actually tested
- Weekly BTC and ETH DCA results
- Why the 707% RSI result did not build the largest pot
- What the RSI gates changed
- How the MACD DCA strategy compared
- Drawdown is the part a retirement headline can hide
- What this says—and does not say—about retirement planning
- How to reproduce the comparison in HeyTraders
- Limitations of this crypto DCA comparison
- Frequently Asked Questions
If you had earmarked $100 every week for Bitcoin and Ethereum, would it have been better to buy automatically, wait for an oversold RSI reading, or invest only when MACD was positive?
We ran five real crypto DCA backtests in HeyTraders over the same 2019–2026 period. The direct answer was not the strategy with the largest return percentage. Buying $50 of BTC and $50 of ETH every week produced the largest normalized ending balance: $161,327.89 from $40,000 of planned contributions. The positive-MACD rule ranked second at $115,576.65.
RSI below 30 showed the highest engine return, 707.09%, but it made only 21 purchases. If every skipped contribution remained as cash earning 0%, that whole plan ended at just $47,428.16. For a retirement-planning question, capital efficiency and final savings are different measurements.
This is a historical research example, not a retirement recommendation. All five crypto paths experienced severe simulated drawdowns, and the test omits taxes, inflation, cash interest, custody risk, and the rest of a diversified retirement portfolio.
Crypto DCA backtest: the question we actually tested
Investor.gov defines dollar-cost averaging as investing equal portions at regular intervals regardless of market movement. Our weekly baseline follows that definition. The indicator variants are more accurately described as DCA-style contribution rules: the same $50 ticket is available each week, but it is invested only when a technical condition is true.
The comparison asks a narrow historical question:
If a saver reserved two $50 tickets each week—one for BTC and one for ETH—which rule produced the largest balance, assuming unused tickets stayed in zero-yield cash?
Every run used the same core settings:
| Setting | Value |
|---|---|
| Market | Binance Spot |
| Assets | BTC/USDT and ETH/USDT |
| Test period | January 1, 2019–September 8, 2026 |
| Timeframe | One week |
| Eligible purchase | $50 per asset |
| Planned budget | 800 tickets × $50 = $40,000 |
| Engine capital setting | $50,000 |
| Trading cost assumptions | 0.10% fee and 0.05% slippage |
| Leverage | None |
The strategy settings recorded $50,000 of capital, which is above the $40,000 schedule. For the retirement-plan comparison, however, the relevant budget is the $40,000 that was actually scheduled: 400 weekly decision points across two assets, or 800 possible $50 purchases. We do not treat all $50,000 as a lump-sum deposit on day one.
The HeyTraders return percentage uses the contributions a rule actually deployed. We therefore added a second, transparent calculation for this article:
Normalized plan ending value = $40,000 planned contributions + engine profit.
That calculation treats every skipped $50 ticket as cash with no interest. It is not another HeyTraders metric, and it does not change the underlying backtest.
Weekly BTC and ETH DCA results
| Contribution rule | Fills / deployed | Engine return | Plan ending value* |
|---|---|---|---|
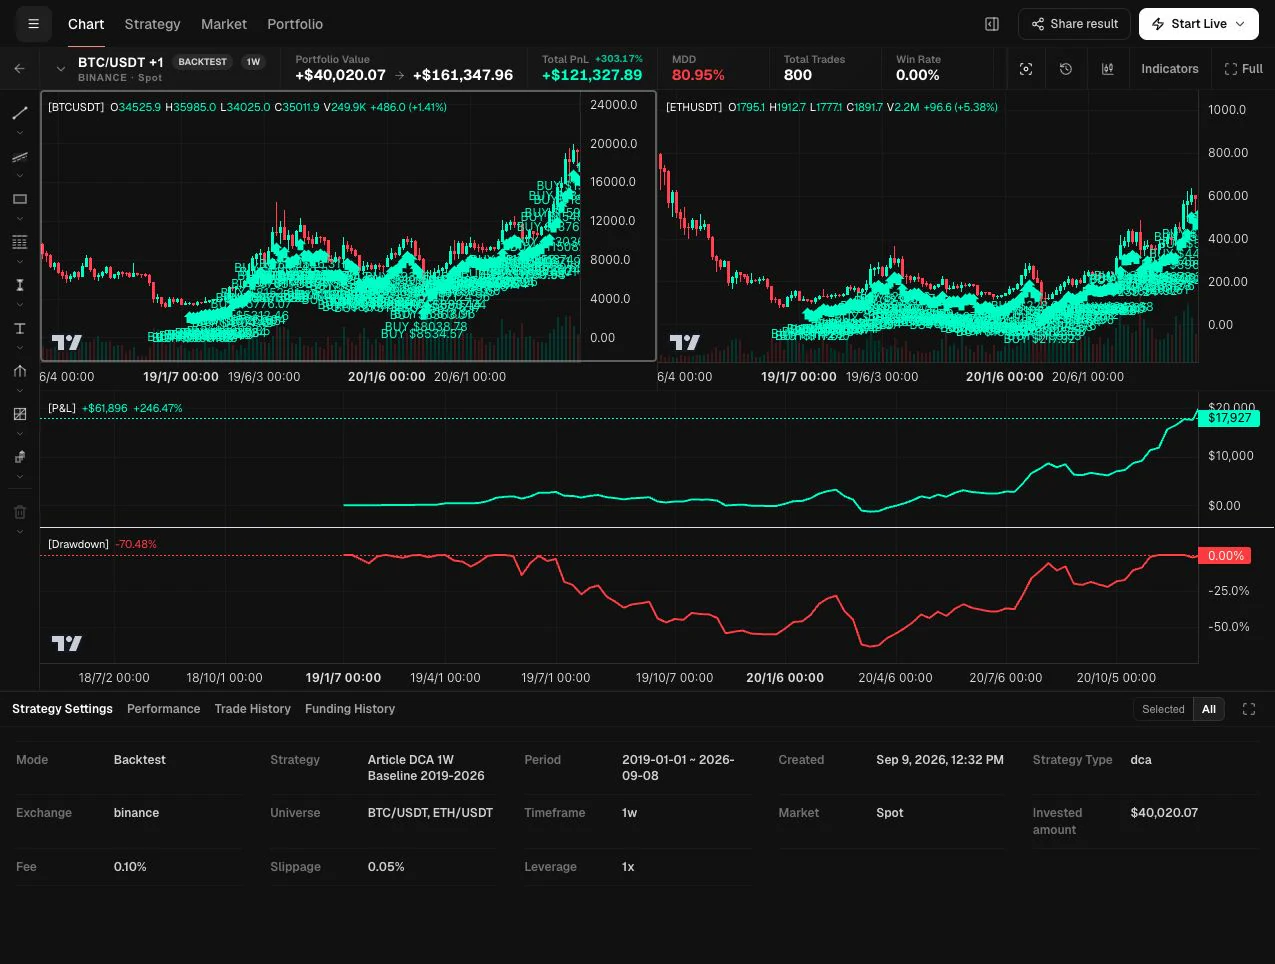
| Buy both every week | 800 / $40,000 | 303.17% | $161,327.89 |
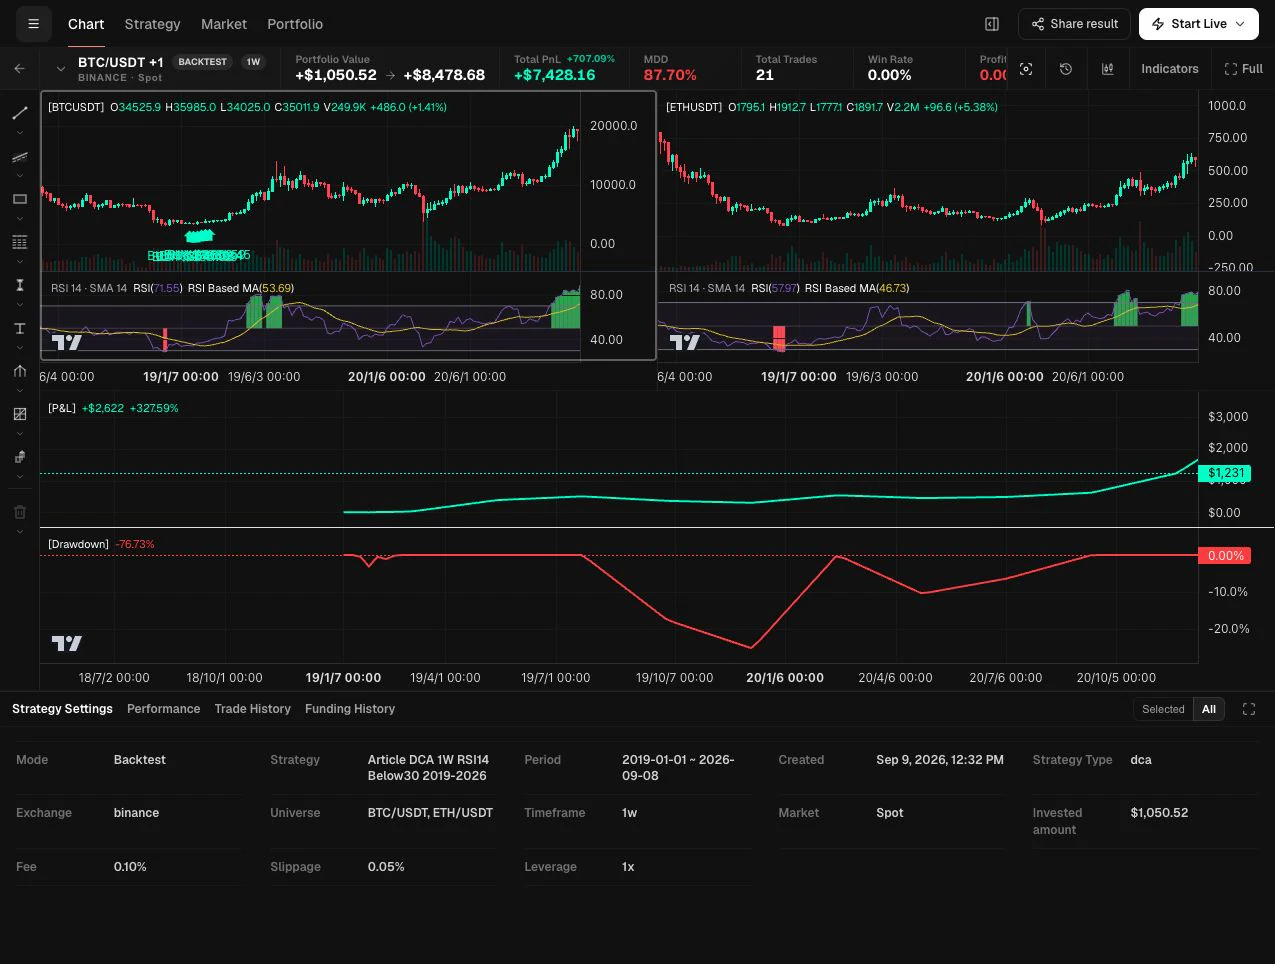
| Buy when RSI(14) < 30 | 21 / $1,050 | 707.09% | $47,428.16 |
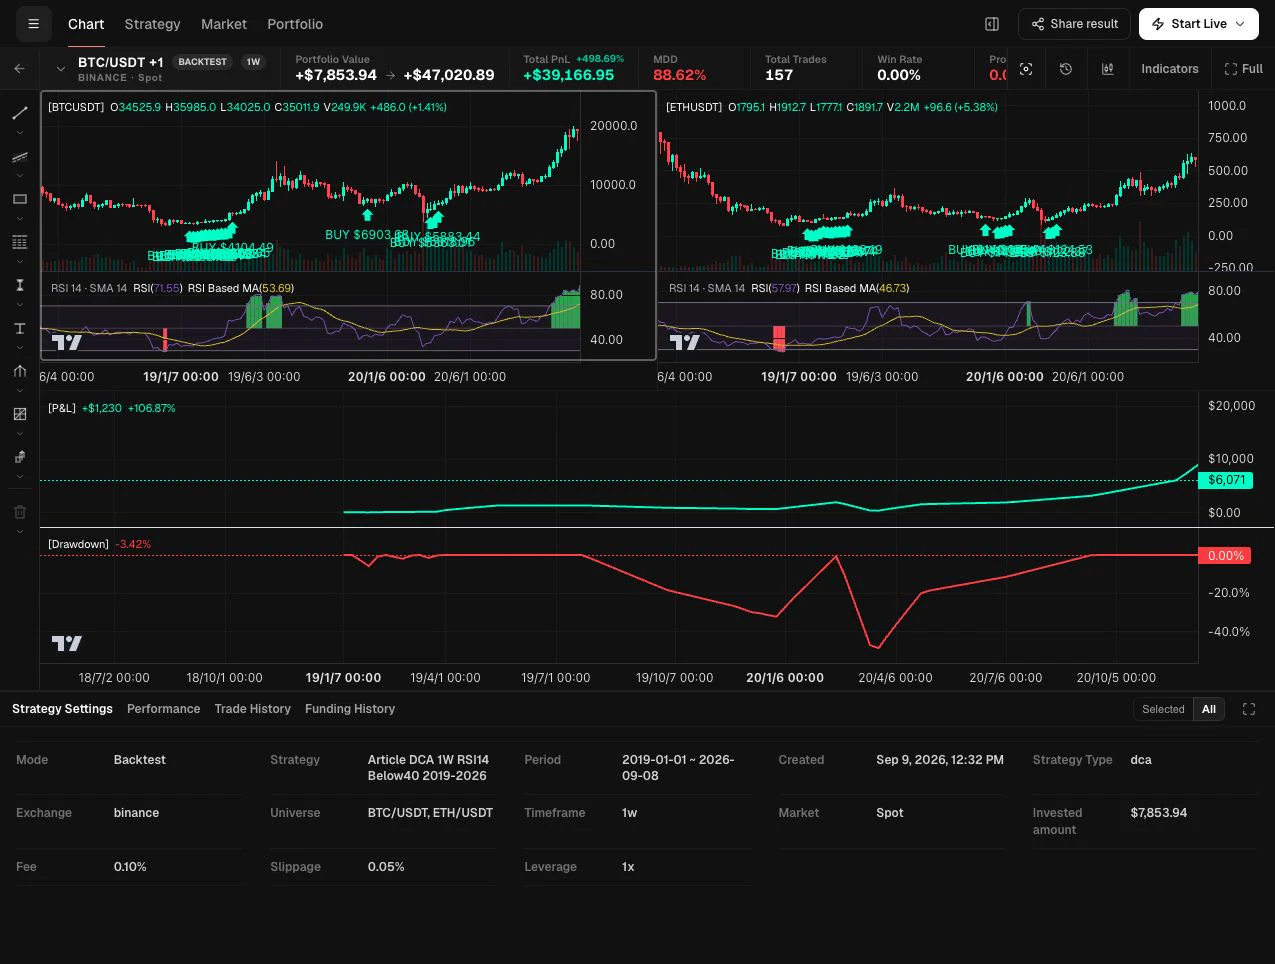
| Buy when RSI(14) < 40 | 157 / $7,850 | 498.69% | $79,166.95 |
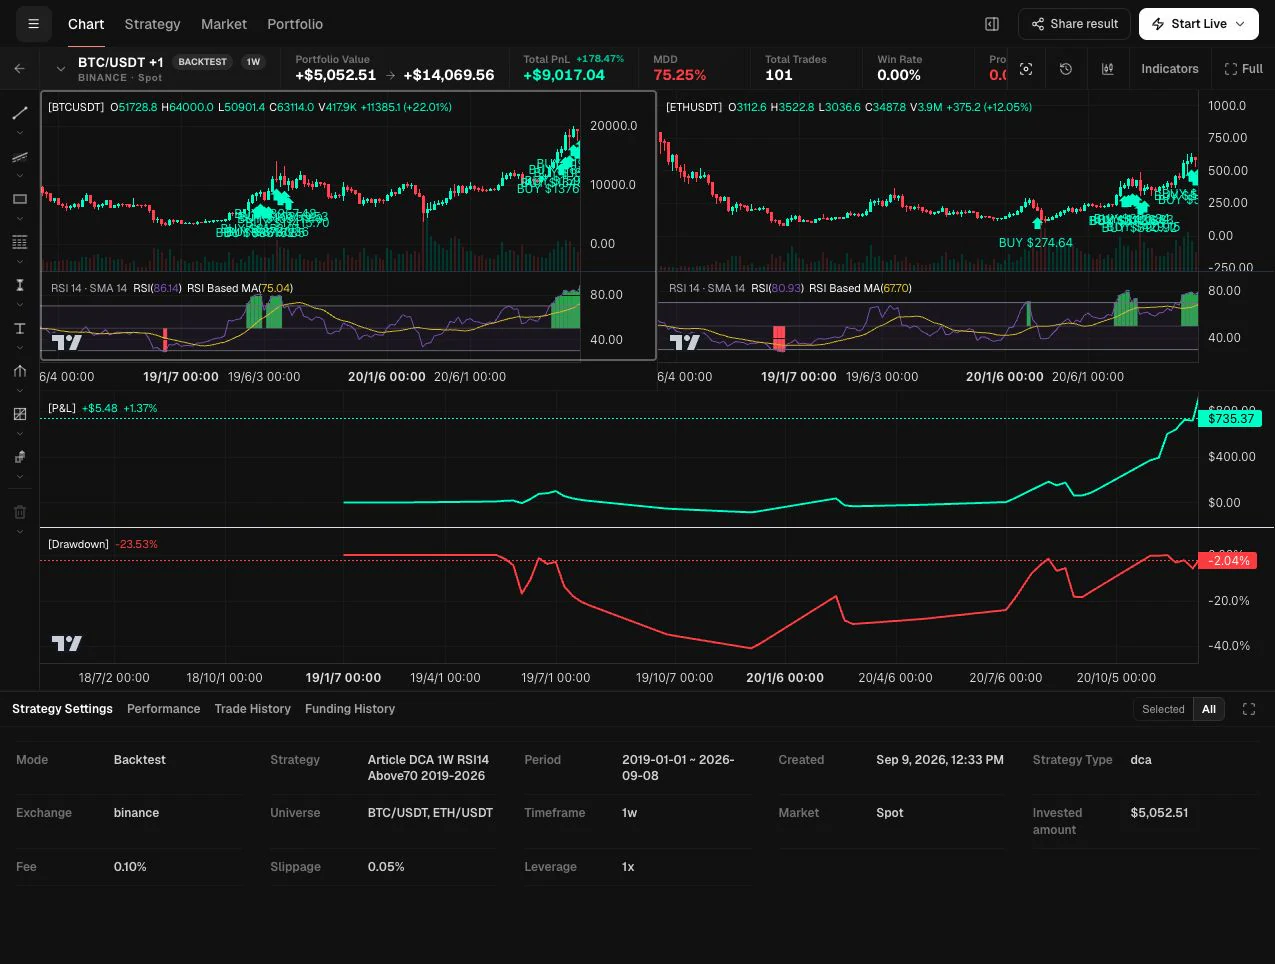
| Buy when RSI(14) > 70 | 101 / $5,050 | 178.47% | $49,017.04 |
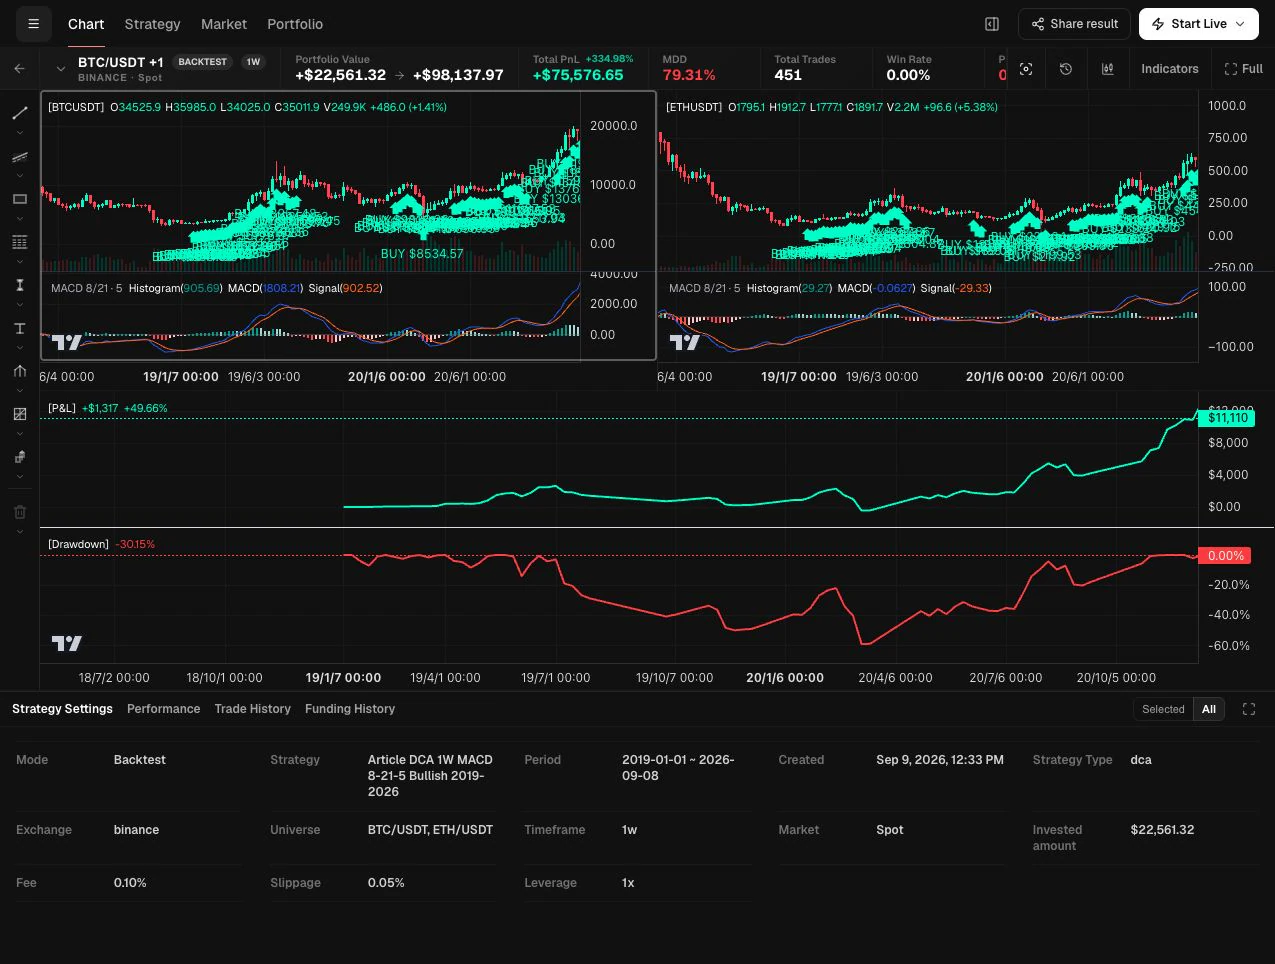
| Buy when MACD(8,21,5) histogram > 0 | 451 / $22,550 | 334.98% | $115,576.65 |
*Plan ending value adds each run’s engine profit to the full $40,000 planned contribution budget, with every skipped ticket held as zero-yield cash.
Each run below includes a public, read-only HeyTraders result link. It lets you inspect the saved strategy settings, chart, indicators, and historical backtest output; it cannot start Paper or Live trading or place an order.
Backtest evidence
Five runs, one controlled comparison
Every screenshot uses the same BTC and ETH universe, weekly timeframe, test period, fees, slippage, and purchase size. Only the weekly entry gate changes.
Use the controls or arrow keys. On a touch screen, swipe left or right.
-
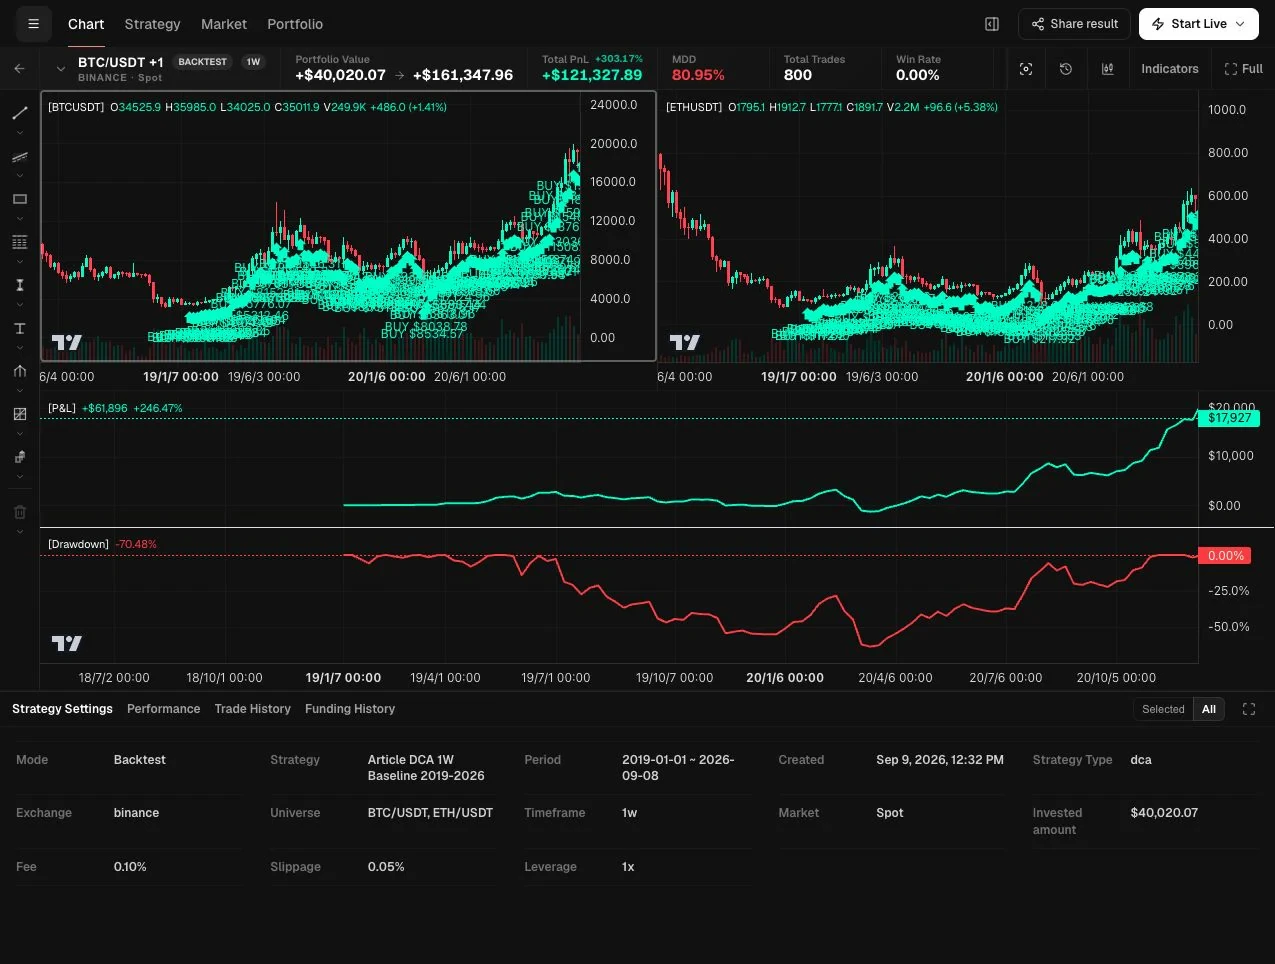
The aggregate All view records 800 fills, a 303.17% engine return, and $121,327.89 in simulated profit. No indicator pane appears because this rule has no technical entry gate. Open full backtest result (new tab) -
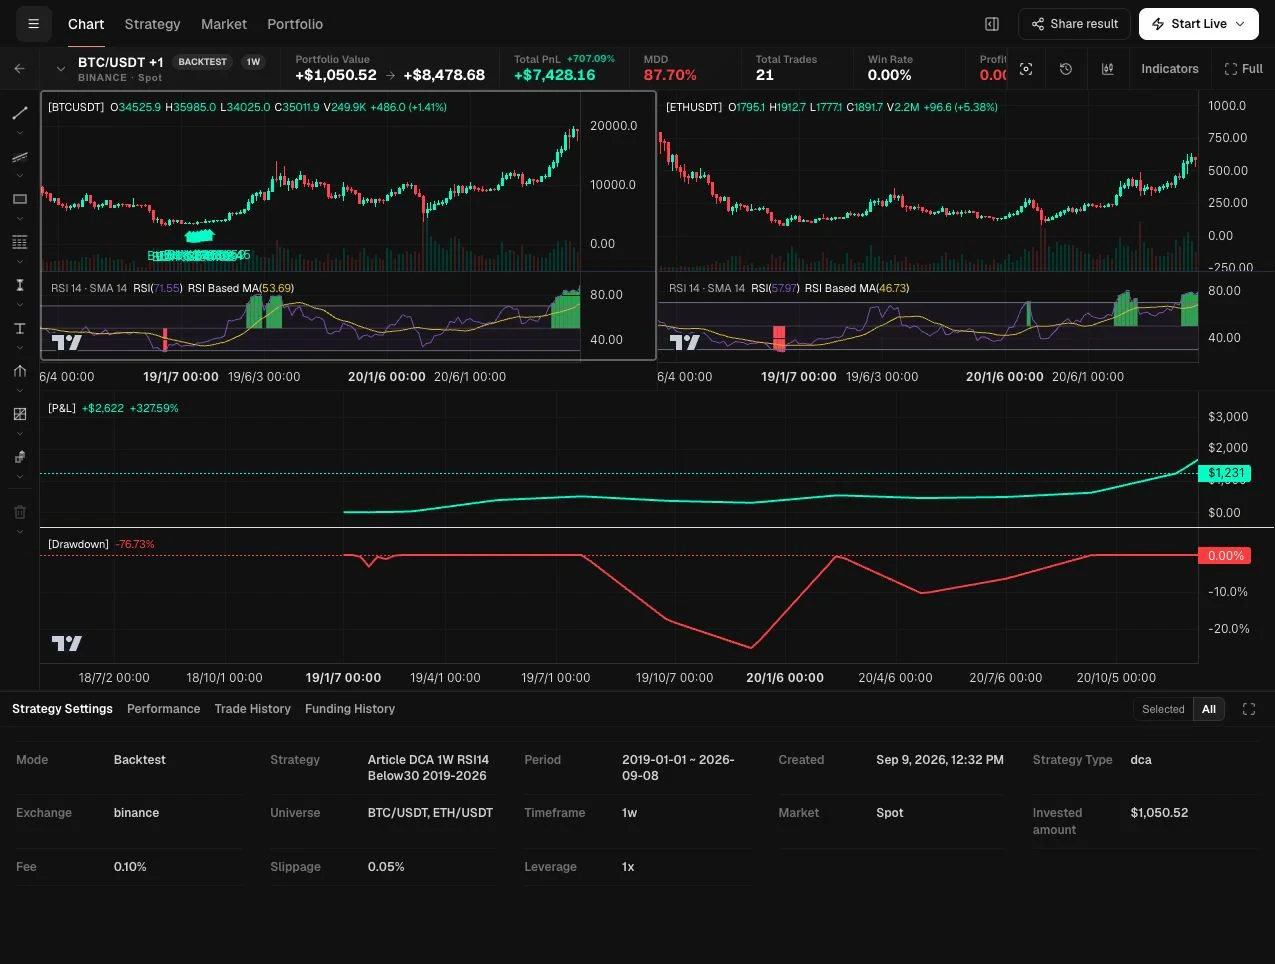
The aggregate All view records 21 fills, a 707.09% engine return, and $7,428.16 in simulated profit. The RSI panes make the rule's very selective entry pattern visible. Open full backtest result (new tab) -
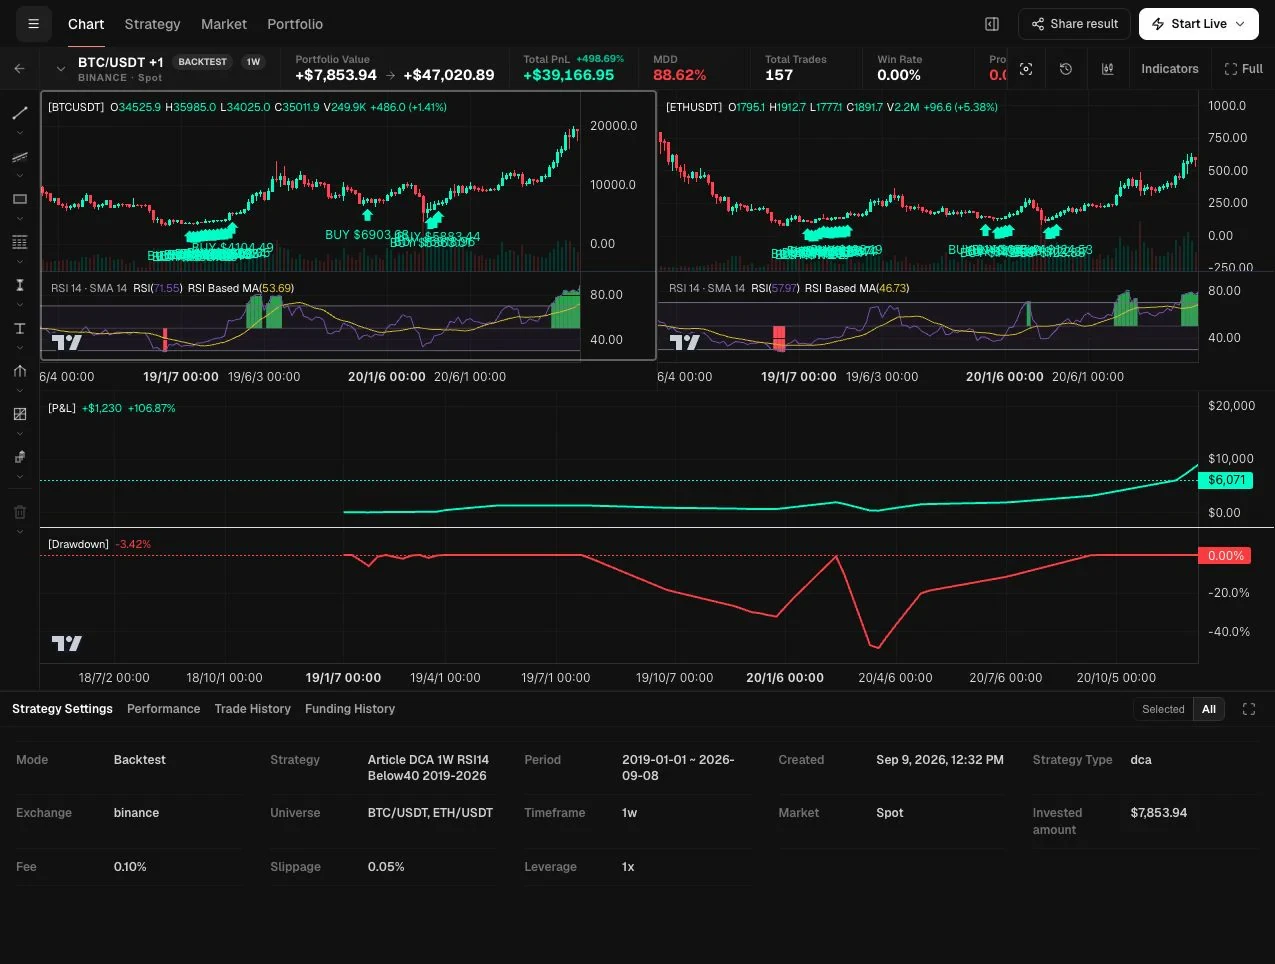
The aggregate All view records 157 fills, a 498.69% engine return, and $39,166.95 in simulated profit. The higher threshold admitted more weekly pullbacks than RSI below 30. Open full backtest result (new tab) -
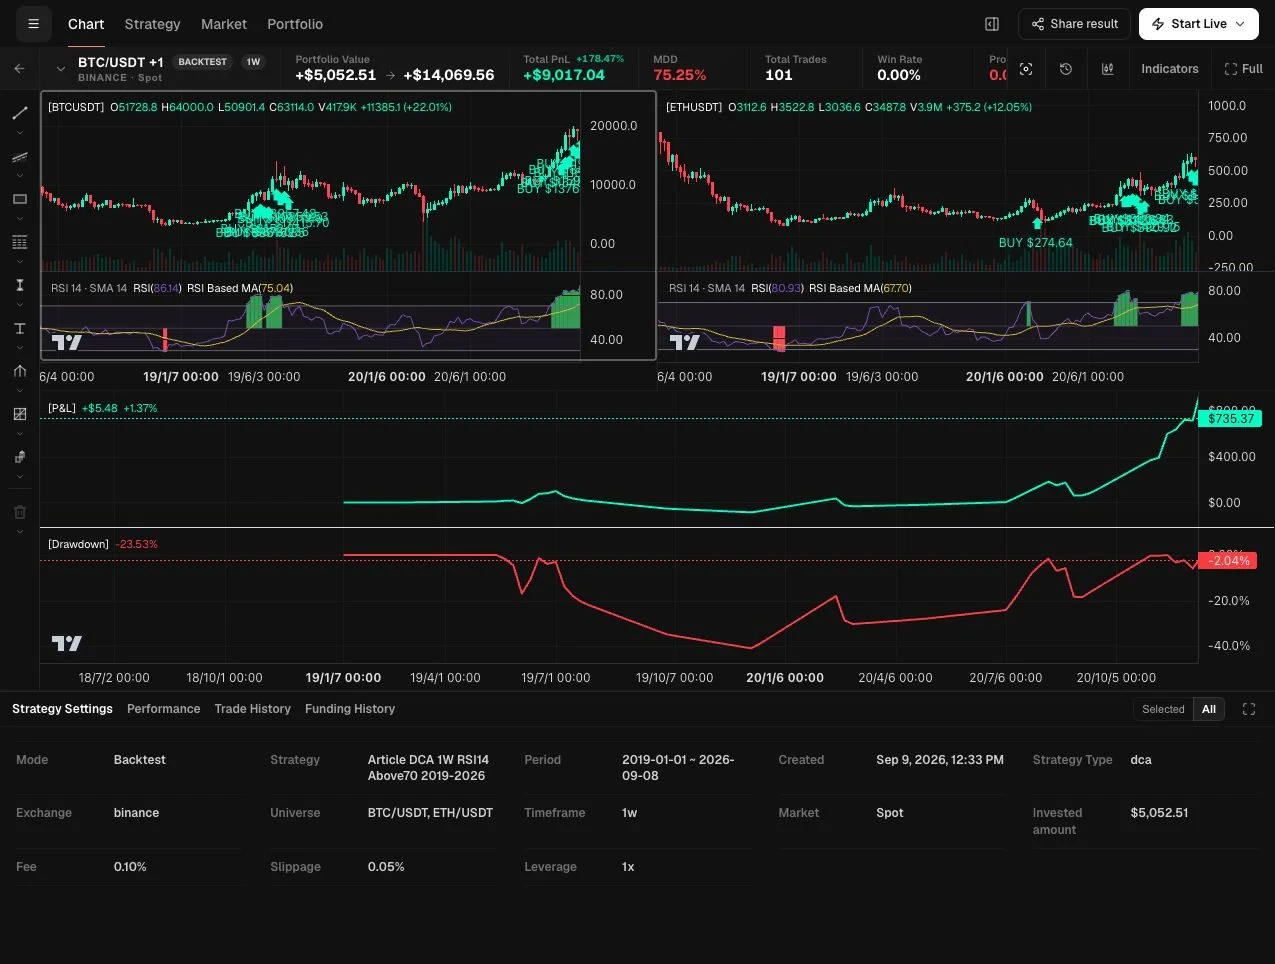
The aggregate All view records 101 fills, a 178.47% engine return, and $9,017.04 in simulated profit. This is the overbought or strong-momentum variant, not an oversold rule. Open full backtest result (new tab) -
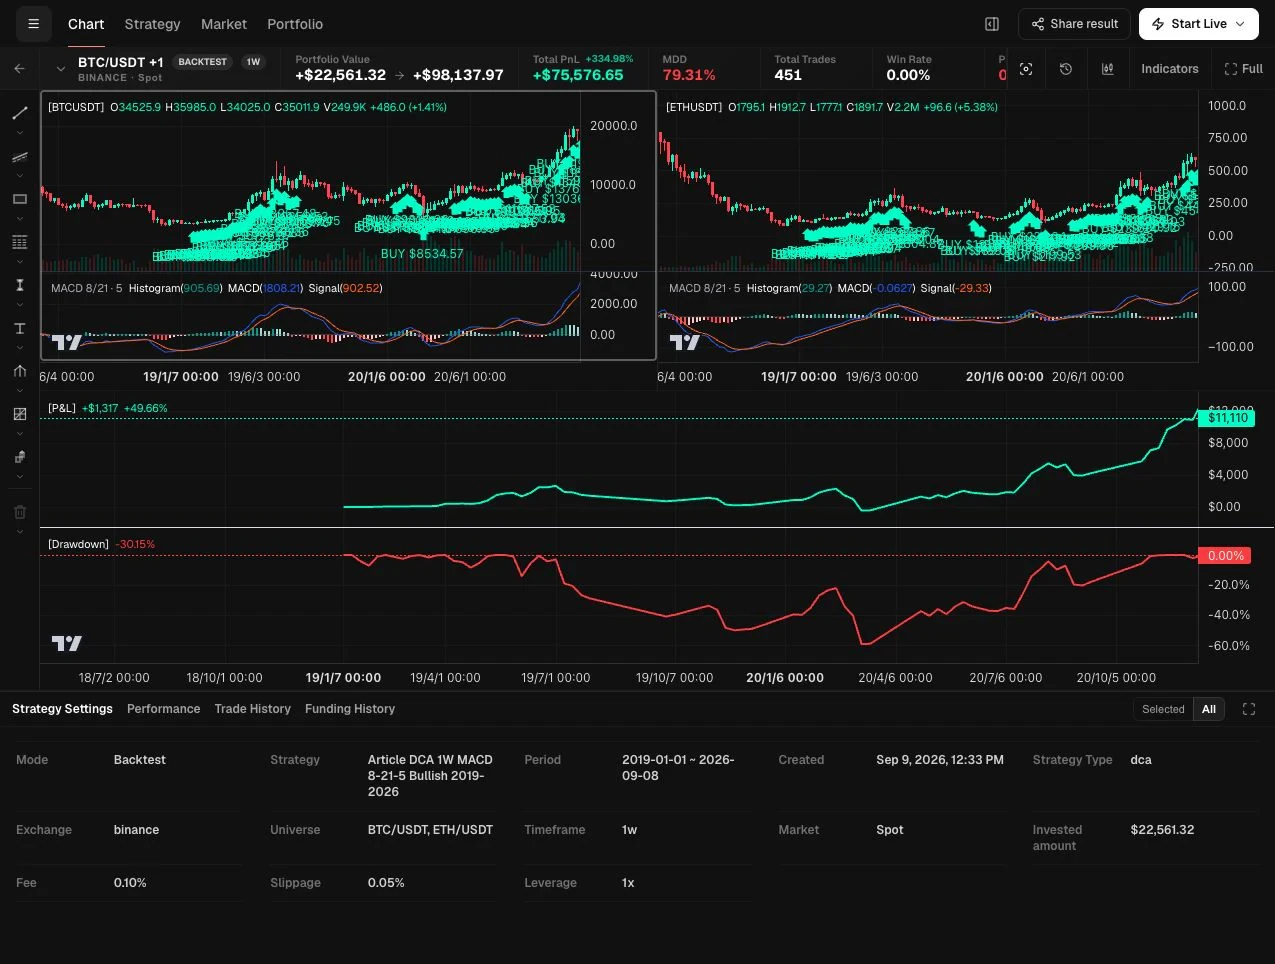
The aggregate All view records 451 fills, a 334.98% engine return, and $75,576.65 in simulated profit. Both asset charts show Histogram, MACD, and Signal together. Open full backtest result (new tab)
All five screenshots are historical backtests captured September 11, 2026. No Paper or Live trading was started. Each result link is public and read-only. The engine's portfolio start uses its accumulated invested-amount basis; the table's plan ending value instead adds engine profit to the full $40,000 planned contribution budget.
The weekly baseline won the final-balance comparison because it put the entire planned budget to work through the full historical rise in both assets. The MACD rule invested a little over half the budget and captured enough of the positive-momentum periods to finish second.
The result does not prove that buying every week will outperform in the future. It shows what these exact rules did on two assets that survived and appreciated substantially during this particular window.
Why the 707% RSI result did not build the largest pot
“Return” needs a denominator. The RSI-below-30 rule earned $7,428.16 on only $1,050 of executed purchases, producing the eye-catching 707.09% engine return. But a saver following that rule would have skipped 779 of the 800 planned tickets.
Under our zero-yield-cash assumption, its final plan is:
- $1,050 deployed into BTC and ETH;
- $7,428.16 of simulated profit on those purchases; and
- $38,950 of contributions that were never invested.
Together, that is $47,428.16—not $40,000 multiplied by 707%. Applying the strategy’s return to money it never invested would overstate the outcome.
This is the most useful retirement-planning lesson from the experiment. A selective rule can look exceptionally efficient while leaving most of a long-term savings program inactive. When you compare contribution strategies, track at least four quantities: planned savings, money deployed, idle cash, and the total ending balance.
What the RSI gates changed
RSI is an oscillator, and the direction of the inequality matters.
RSI below 30: rare oversold purchases
RSI(14) below 30 is the conventional oversold condition. It bought only during relatively extreme weekly weakness in this sample. The 21 fills had strong historical capital efficiency, but waiting for those moments created enormous cash drag.
RSI below 40: more pullbacks, still substantial cash
Raising the threshold to 40 admitted 157 fills and produced $39,166.95 of engine profit. The normalized ending value rose to $79,166.95 because more of the contribution budget participated. It still left $32,150 uninvested and finished well behind the automatic weekly rule.
RSI above 70: an overbought momentum gate
RSI(14) above 70 is not a dip-buying rule. It is an overbought or strong-momentum condition. The variant asks whether a saver would have benefited from contributing only when weekly strength was already pronounced. It deployed $5,050, recorded $9,017.04 of engine profit, and produced a $49,017.04 normalized ending value.
These three results should not be read as proof that 30, 40, or 70 is an optimal threshold. They are representative hypotheses selected before comparison, not the winners of an exhaustive parameter search.
How the MACD DCA strategy compared
The MACD variant purchased $50 of each eligible asset when the weekly MACD(8,21,5) histogram was positive. That is a momentum or trend filter: it participates when the faster moving-average relationship is stronger than the slower one.
It produced 451 fills, $75,576.65 of engine profit, and a 334.98% return on deployed contributions. Adding the $17,450 of skipped tickets as zero-yield cash produced a normalized ending value of $115,576.65.
That result sits between the two extremes. It was more selective than the weekly baseline but much more active than the RSI rules. It still trailed the baseline’s final pot because it left 349 scheduled tickets uninvested.
Drawdown is the part a retirement headline can hide
The engine’s maximum drawdown readings were severe:
| Contribution rule | Engine maximum drawdown |
|---|---|
| Buy every week | -80.95% |
| RSI(14) < 30 | -87.70% |
| RSI(14) < 40 | -88.62% |
| RSI(14) > 70 | -75.25% |
| MACD(8,21,5) histogram > 0 | -79.31% |
These figures describe the backtest’s deployed DCA equity path. They are not the drawdown of the normalized whole plan that includes idle cash, so they should not be combined with that column as if both were one account statement.
Even with that distinction, the magnitude matters. A strategy that ends ahead can still spend years far below a previous peak. A retirement saver may need the money on a timetable that does not wait for a crypto recovery. Investor.gov’s crypto-asset alert emphasizes volatility, loss risk, time horizon, asset allocation, and diversification; the CFTC likewise describes virtual-currency trading as high risk.
What this says—and does not say—about retirement planning
This experiment supports three practical conclusions for research:
- Contribution consistency can matter as much as entry efficiency. A high return on a small amount may build less wealth than a lower return on a fully deployed savings schedule.
- Rules need a cash policy. “Do not buy this week” is incomplete unless the plan says what happens to the money—cash, a diversified alternative, a later catch-up purchase, or something else.
- Risk must be measured along the path. The final value alone hides whether the saver could tolerate the drawdown or needed liquidity at the wrong time.
It does not answer how much crypto belongs in anyone’s retirement plan. A real plan also requires income and spending needs, emergency savings, tax-advantaged account rules, inflation, contribution growth, withdrawal timing, asset allocation, custody, and the possibility of permanent loss. Those decisions depend on the individual and may warrant help from a qualified professional.
The fairest use of this backtest is to treat BTC and ETH as a hypothetical crypto sleeve, not as a substitute for a complete retirement portfolio.
How to reproduce the comparison in HeyTraders
Build separate saved backtests so every result retains its own rule and settings. Keep the venue, market, assets, period, timeframe, amount, fees, and slippage identical. Then change only the eligibility condition:
- Buy $50 of BTC/USDT and $50 of ETH/USDT on every one-week evaluation.
- Buy the same amounts only when weekly RSI(14) is below 30.
- Repeat with RSI(14) below 40.
- Test RSI(14) above 70 as a momentum gate.
- Test a positive MACD(8,21,5) histogram.
Before comparing the output, inspect the generated script and Strategy Settings. Confirm that both assets, the weekly timeframe, spot market, amount, period, fee, and slippage are what you intended. Then record the fill count and profit alongside the percentage return.
For a stronger follow-up study, reserve a later out-of-sample period before adjusting thresholds. Changing RSI and MACD parameters until one historical chart looks best would create a multiple-testing problem, not reliable retirement evidence. Our AI backtesting guide explains how to review generated rules, and What Is Backtesting? covers timing, costs, overfitting, and drawdown in more detail.
Limitations of this crypto DCA comparison
- Selection and survivor bias: BTC and ETH are surviving large-cap assets chosen with hindsight. The test does not include assets that failed, disappeared, or underperformed.
- One venue and data history: Results use Binance Spot candles and the stated 2019–2026 window. Another venue, starting date, or data treatment can change them.
- Exploratory parameters: Five representative rules were compared. They were not optimized exhaustively, and no separate holdout result is presented here.
- Execution assumptions: The engine used a 0.10% fee and 0.05% slippage. Actual costs, spreads, order behavior, liquidity, and custody differ.
- Cash earns zero: Skipped tickets are treated as idle cash with no interest. Giving that cash a yield or investing it elsewhere would change the normalized comparison.
- No taxes or inflation: All figures are nominal. They are not after-tax purchasing power or retirement income.
- No rebalancing or withdrawals: The rules only accumulate. They do not model target allocation, withdrawals, sequence-of-returns risk, or a retirement date.
- Historical performance only: The result cannot predict future returns, market structure, regulation, or whether either asset will remain suitable or available.
For a broader set of rule patterns, see our trading strategy templates and Bitcoin trading strategies. Use those as hypotheses to test, not as recommendations to deploy.
Frequently Asked Questions
Did weekly crypto DCA beat the RSI and MACD rules?
In this 2019–2026 BTC and ETH test, buying every week produced the largest normalized plan ending value: $161,327.89 from $40,000 of planned contributions. The MACD-filtered rule finished second at $115,576.65. This is one historical simulation, not a forecast or a universal strategy ranking.
Why did RSI below 30 show the highest return but a much smaller ending balance?
It made only 21 $50 purchases, so it deployed $1,050 of the $40,000 planned contribution budget. Its 707.09% engine return applied to that small deployed amount. When skipped contributions are kept as zero-yield cash, the normalized plan ends at $47,428.16.
Is RSI above 70 an oversold crypto DCA strategy?
No. RSI above 70 is conventionally an overbought or strong-momentum condition; RSI below 30 is the oversold condition. In this article, both are tested as mechanical gates for a weekly contribution, not as universal buy signals.
Can a crypto DCA backtest create a retirement plan?
No. It can test how a contribution rule behaved historically, but it does not determine an appropriate crypto allocation, retirement income need, tax treatment, inflation assumption, withdrawal plan, or custody arrangement. Crypto can experience severe losses and may be unsuitable for a given saver.
Can I reproduce this BTC and ETH DCA comparison in HeyTraders?
Yes. Create separate one-week DCA backtests with the same assets, period, purchase size, fee, and slippage settings, then change only the entry gate: always, RSI below 30, RSI below 40, RSI above 70, or positive MACD(8,21,5) histogram. Review the generated rules and each result before comparing them.
One last thing
Was this story helpful?
Your perspective helps us improve our guides.
No sign-in needed. An anonymous session remembers your response on this browser. Privacy
A little more perspective.
How to Read Backtest Results: Is This Strategy Right for You?
Follow one hypothetical result from an 80% return to its drawdown, recovery time, and trade distribution, then decide what fits your own capital and risk tolerance.
What Is Backtesting? Why It Matters for Crypto Trading
Turn a trading idea into a testable strategy. Understand the results, the three major biases, and the execution details that change a backtest.
AI Backtesting: Test a Trading Strategy in Plain English
AI backtesting converts a plain-English trading idea into precise rules, runs those rules on historical data, and helps you inspect risk before considering live automation.