What Is Backtesting? Why It Matters for Crypto Trading
Turn a trading idea into a testable strategy. Understand the results, the three major biases, and the execution details that change a backtest.
In this story
- What is backtesting?
- Why backtest a trading strategy?
- How does a backtest work?
- What should you look at in the results?
- Three biases that can distort a backtest
- Implementation details that change the result
- How much evidence is enough?
- Backtesting and paper trading
- Can you backtest without coding?
- Start with one trading idea
You notice that BTC often keeps rising after a strong breakout. You could trade that idea manually, or build a trading bot to act on it whenever the setup appears.
Before committing money, you want to know what happens when you follow the rule repeatedly. How many breakouts fail? How large are the losses? Do the gains survive trading costs?
Backtesting lets you investigate those questions by applying your strategy to historical market data.
For anyone building a crypto trading bot, it is a way to turn an idea into a record of trades you can inspect—before running it with real money.
What is backtesting?
Backtesting is the process of simulating a trading strategy using historical data.
You define the rules: when to enter, when to exit, how much to trade, and how orders should execute. A backtest then applies those rules across a chosen period and calculates the resulting trades, costs, and account value.
For example, you could test a strategy that:
- Buys BTC when an hourly close crosses above its 50-hour moving average.
- Exits when an hourly candle closes below it.
- Allocates 10% of available capital to each entry.
- Holds no more than one position at a time.
Instead of manually searching charts for examples, you can examine every trade the rules would have produced within the test period.
The result is a simulated trading history. It shows how the strategy behaved under the market conditions and execution assumptions you selected.
The same process can be used for momentum, mean reversion, DCA, grid trading, pairs trading, arbitrage, and portfolio rebalancing. Each strategy needs data and execution assumptions that reflect how it operates.
Why backtest a trading strategy?
A trading idea often starts with an observation.
“Strong moves tend to continue.”
“Sharp selloffs sometimes reverse.”
“Buying regularly would be easier than choosing an entry every week.”
Those observations can become momentum, mean-reversion, or DCA strategies. But an observation leaves many practical questions unanswered.
Backtesting helps you explore what happens when you turn it into a repeatable set of rules.
See more than the trades that caught your attention
It is easy to notice a clean breakout that led to a large rally. The same entry rule may also have triggered several losing trades before that rally began.
A backtest applies the rule throughout the selected period, including the signals you might overlook when browsing a chart.
You can see how often the opportunity appeared, how many trades followed, and how gains and losses were distributed.
Understand the losses along the way
Two strategies can finish with similar returns and feel very different to trade.
One may experience frequent small losses. Another may spend months below its previous peak before recovering.
Backtesting makes that path visible. You can examine how far the account fell, how long recovery took, and whether the strategy’s position sizing would have been manageable.
That matters when deciding how much capital to allocate—and whether you could realistically keep running the strategy through a difficult period.
See what trading costs change
A strategy can capture small price movements repeatedly and still struggle after costs.
Crypto trading may involve exchange fees, bid–ask spreads, slippage, and funding payments for perpetual futures. Their impact depends on how frequently the strategy trades and how it executes.
Including relevant costs lets you see how much of the simulated return remains after paying to trade.
This is particularly important for high-turnover strategies, where a small cost on each transaction can accumulate quickly.
Learn which market conditions suit the strategy
Crypto markets move through rallies, selloffs, and sideways periods.
A momentum strategy may benefit from sustained trends while repeatedly entering and exiting during choppy conditions. A grid strategy may behave differently when price oscillates within a range than when it moves persistently in one direction.
Testing across different periods helps you understand where the strategy’s returns came from and where it struggled.
That gives you a more useful picture than a single total-return number.
How does a backtest work?
Most backtests follow the same basic process.
1. Turn the idea into clear rules
“Buy a strong dip” leaves room for interpretation.
A testable rule specifies what counts as a dip, which data to use, when to evaluate the condition, and what order to place.
You also need rules for exits and position sizing. Those choices can change the result as much as the entry signal.
2. Collect the historical data
Select the market, timeframe, and test period, then collect the historical data your strategy needs.
Check that the data covers the requested period and identify any missing intervals before running the test.
3. Set the trading assumptions
Specify starting capital, order sizing, fees, and how simulated orders fill.
For the hourly moving-average example, the signal becomes available after the candle closes. The simulated entry should reflect an execution opportunity after that signal becomes known.
If the strategy uses leverage, funding and liquidation assumptions also matter.
4. Run the simulation
The backtest moves through the historical data, evaluates the rules, and records simulated orders and positions.
As trades open and close, it tracks cash, holdings, costs, and account value—including the changing value of open positions.
5. Inspect the results
Start by checking whether the trades match the strategy you intended to test.
Then examine performance, losses, trading frequency, and capital usage. The trade history helps explain the summary numbers.
For a detailed walkthrough, see How to Backtest a Trading Strategy.
What should you look at in the results?
Start with three views: the trades, the equity curve, and the drawdowns.
The trades: did the strategy behave as intended?
Look at the entries and exits on the price chart.
Did it buy when the condition was met? Did positions close for the expected reason? Were there repeated entries you did not intend?
A profitable result is difficult to interpret if the underlying rules behaved differently from your idea.
The equity curve: how did the account change?
An equity curve shows the simulated account value over time.
It helps you see whether gains accumulated throughout the period or came from a handful of trades. It also shows stretches where the strategy made little progress or lost money.
Where appropriate, compare it with a simple alternative, such as holding the same asset over the same period. Account for differences in exposure and capital allocation when making that comparison.
The drawdowns: what happened between the peaks?
A drawdown measures the decline from a previous peak in account value.
Maximum drawdown shows the deepest such decline during the test. Drawdown duration shows how long the account remained below its previous peak.
Together, they help describe the experience of staying with the strategy.
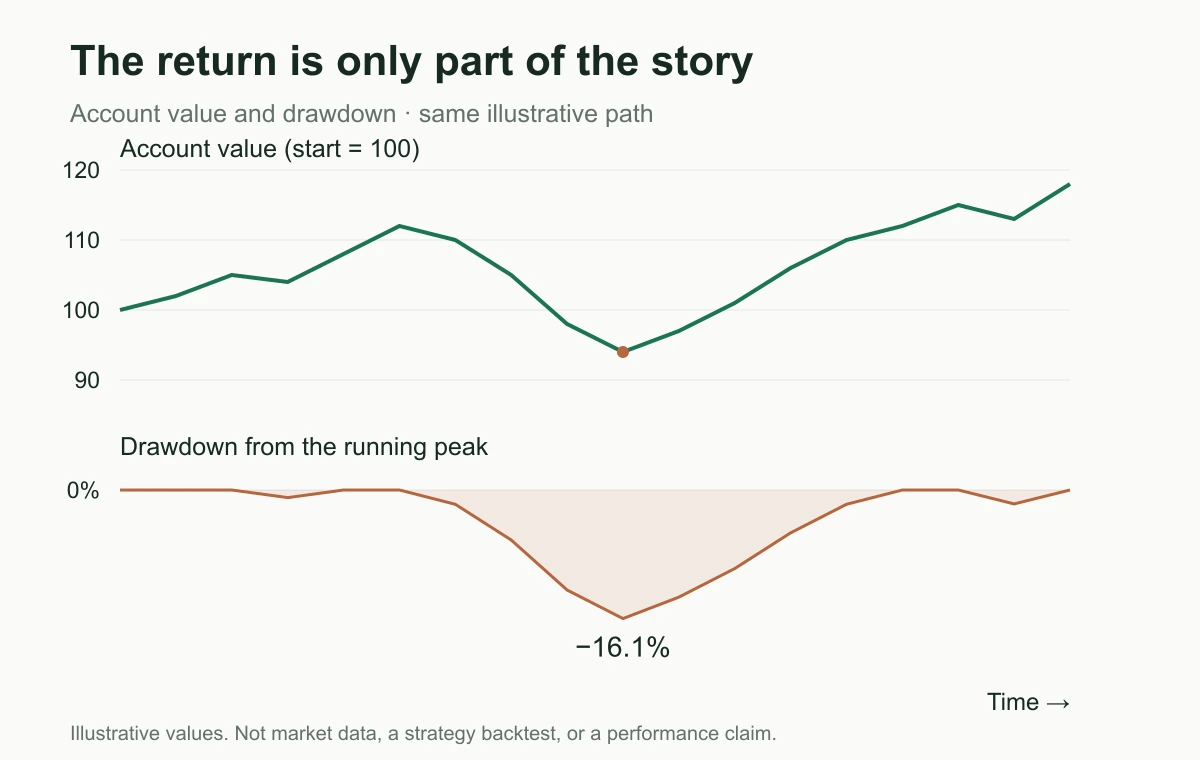
The drawdown is calculated from the same illustrative account-value path shown above. These are explanatory values, not a strategy’s historical results.
Other useful numbers include:
- Net return: the simulated gain or loss after included costs.
- Trade count: how many trades contributed to the result.
- Average win and loss: how much successful and unsuccessful trades typically made or lost.
- Exposure: how much capital was invested and for how long.
- Total trading costs: how much fees and other modeled costs consumed.
Win rate needs context. A strategy can win frequently but lose heavily on its unsuccessful trades, or win less often while making larger gains when it succeeds.
For a closer look at performance metrics, see Sharpe Ratio, Maximum Drawdown, and Win Rate.
Three biases that can distort a backtest
A backtest can follow its code correctly and still answer the wrong question. The way you choose data, build features, and select strategies matters.
Look-ahead bias: using information before it existed
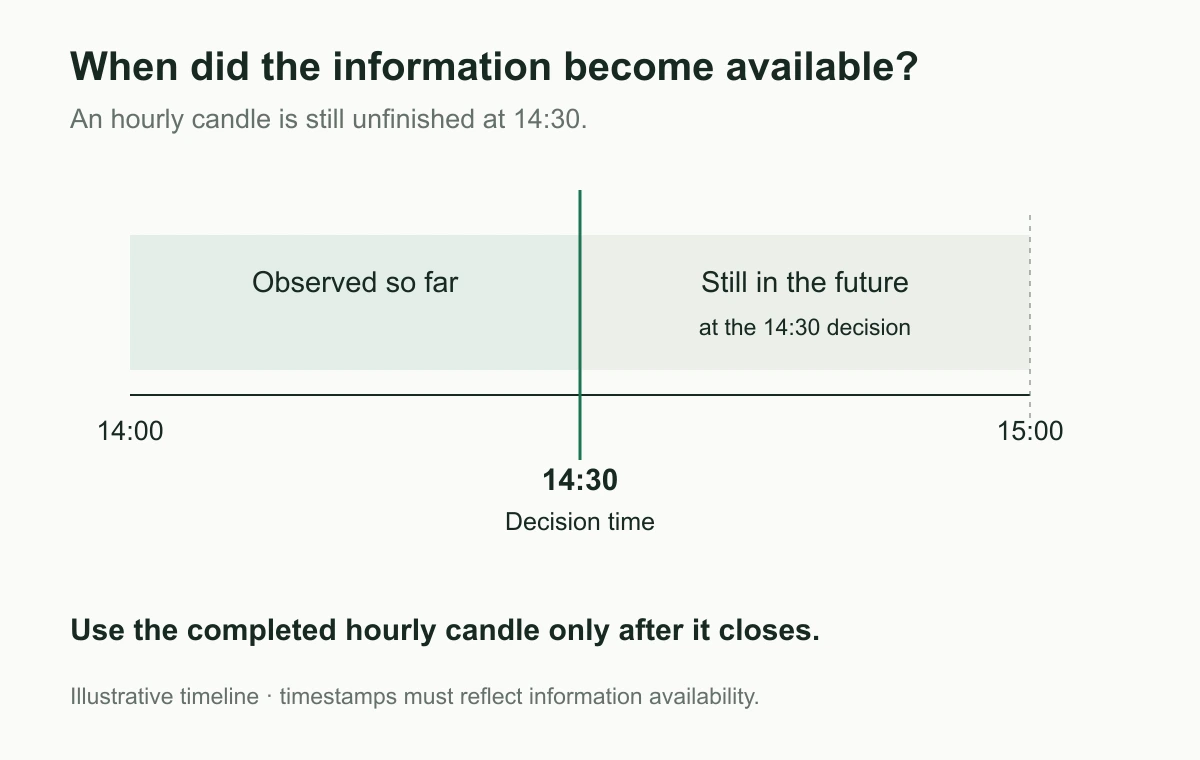
Look-ahead bias occurs when a simulated decision uses information that was unavailable at the time.
Suppose a bot makes decisions every minute but uses an hourly moving average. At 14:30, the final closing price of the 14:00–15:00 candle is still unknown. Giving the bot that completed candle lets it trade with information from the future.
The same problem can appear when a calculation uses the full dataset. For example, normalizing early observations using a mean and standard deviation calculated over the entire test period introduces information from later dates.
The implementation needs to distinguish a data point’s label from the time it became available. Signals using completed candles should receive them only after they close. External data and revised statistics need the same attention to availability.
Overfitting: selecting settings that fit historical noise
Suppose you try many moving-average lengths, stop-loss levels, assets, and date ranges, then choose the combination with the highest return.
Some combination may look excellent simply because it happens to fit that history. The more alternatives you test, the more opportunities you have to discover a lucky result.
Overfitting also happens through manual decisions: removing a bad year, dropping a losing asset, or adding a rule after inspecting a disappointing trade.
Keep a separate period for evaluation, and check whether nearby parameter choices produce reasonably consistent behavior. Record what you tried. Once you repeatedly inspect a holdout period and adjust the strategy around it, that period has become part of development too.
Walk-forward testing can extend this approach: develop or tune on an earlier window, evaluate on a later window, and advance through time. It still requires care over how often you revise the research process after seeing results.
Survivorship bias: testing only the assets that remain
Imagine testing a crypto portfolio strategy over several years using only coins listed on an exchange today.
Tokens that were delisted or failed may be absent. Some current constituents may not even have existed at the beginning of the test. The resulting portfolio does not represent the choices available to a trader at each historical date.
A historical universe should reflect which assets were eligible at the time, including relevant listing and delisting events. Missing data and final exits also need explicit treatment.
This matters especially for strategies described as trading “the top coins” or selecting from “all available pairs.” Today’s list is not automatically the correct list for the past.
Implementation details that change the result
A backtest engine needs rules for turning signals into trades and trades into account balances. Those rules can materially affect performance.
Signal time and fill time
A strategy that evaluates a candle after it closes cannot retroactively place an order earlier inside that candle.
For example, a limit order created after observing the close should not be filled just because that candle’s earlier low crossed the limit price. The order did not exist then.
Check when the signal becomes available, when the order enters the simulation, and which subsequent prices can fill it. Assuming a fill at the signal candle’s closing price also needs justification; observing a close does not guarantee execution at that exact price.
Price touches, available liquidity, and trading costs
A limit price appearing in historical data does not prove that your entire order could have filled there. Other orders may have been ahead of yours, and the available quantity may have been small.
A candle-based engine commonly simplifies those details. A fixed slippage allowance can help represent execution costs, but it does not recreate historical order-book depth, queue position, or market impact.
Understand the model being used. Include fees on the relevant transactions, test plausible execution-cost assumptions, and be especially careful when large orders or small per-trade profits drive the result.
Funding payments in perpetual futures
Perpetual positions can pay or receive funding while they are open. Funding rates vary over time, so applying today’s rate throughout a historical test can misstate the cash flows.
For example, a $10,000 long position subject to a positive 0.01% funding payment would pay $1 at that event under a simple linear-contract calculation. Repeated payments can accumulate over a long holding period; negative funding can reverse the direction of the payment.
A funding-aware backtest needs the historical settlement events, the applicable rate, and the position held at each event. It also needs the correct reference price and contract units. Linear and inverse contracts can settle in different currencies.
Event ordering matters too. If an entry or exit occurs at a funding boundary, the simulation must define whether that position participates in the payment. It should not charge funding for periods before the position opened or while it was flat.
Funding history used to calculate payments is also different from the predicted funding information a strategy might have observed before settlement. Using the eventual settled rate to make an earlier trade can introduce look-ahead bias.
Open positions and account value
An account-value curve should include the changing value of open positions, alongside cash and realized gains or losses.
A curve based only on closed trades can conceal losses still sitting in open positions. This is particularly important for strategies that average into losing trades or hold them for long periods.
Check how the test treats positions still open at the end: whether it values them at the final observation or simulates a closing trade, and which closing costs are included. That choice should be visible when comparing results.
How much evidence is enough?
A result based on a few trades tells you less about repeatability than one observed across many relevant opportunities. A large number of trades clustered around the same market event may also provide less independent evidence than the count suggests.
There is no single trade count or test duration that suits every strategy. A monthly allocation strategy and an intraday trading bot naturally produce different amounts of evidence.
Look at the variety of conditions encountered, the concentration of profits, and performance on data you did not use to select the strategy. These questions help you decide what to test next.
Backtesting and paper trading
Backtesting shows how the rules behaved on historical data. Paper trading runs them on incoming market data using simulated funds.
Paper trading lets you observe the strategy as new conditions arrive and check whether signals, orders, and position management operate as expected.
Its fills are still simulated, so it cannot fully establish how live execution will perform. It is another useful step between a historical test and committing capital.
Can you backtest without coding?
You can backtest manually, write your own program, or use software that lets you define strategies through settings or natural language.
Manual testing can help you learn how a simple rule behaves. Software makes it easier to apply rules consistently across longer histories and more markets.
With HeyTraders, you can describe an idea to Hetty, turn it into a strategy, and backtest it. You can then inspect the rules and results before deciding what to change or test next.
A starting request might be:
Backtest a BTC strategy that enters when the hourly close crosses above the 50-hour moving average and exits after a close below it. Use 10% of available cash per entry, allow one position at a time, and include trading fees. Show me the trades, equity curve, and drawdowns.
The more clearly you describe the idea, the easier it is to check whether the test represents what you wanted to trade.
Learn more in AI Backtesting: Test a Trading Strategy in Plain English.
Start with one trading idea
Backtesting gives you a concrete way to examine a strategy: the trades it takes, the capital it uses, the costs it incurs, and the losses it experiences.
Start with one clear idea. Test it, inspect what happened, and use those results to decide your next step.
What trading idea would you like to test?
One last thing
Was this story helpful?
Your perspective helps us improve our guides.
No sign-in needed. An anonymous session remembers your response on this browser. Privacy
A little more perspective.
How to Read Backtest Results: Is This Strategy Right for You?
Follow one hypothetical result from an 80% return to its drawdown, recovery time, and trade distribution, then decide what fits your own capital and risk tolerance.
Crypto DCA Backtest for Retirement Planning: Weekly vs RSI and MACD
We earmarked $100 a week for Bitcoin and Ethereum, then compared automatic weekly buying with RSI and MACD filters in HeyTraders.

AI Backtesting: Test a Trading Strategy in Plain English
AI backtesting converts a plain-English trading idea into precise rules, runs those rules on historical data, and helps you inspect risk before considering live automation.