Mean Reversion in Crypto: How to Build a Strategy
A practical guide to mean reversion in crypto: define the reference mean, build a BTC example, and test what happens when the rebound never arrives.
In this story
- What is mean reversion in crypto?
- Why might a price return toward its mean?
- Three ways to define the mean
- A Bitcoin mean reversion strategy using a rolling z-score
- Three paths after the same entry
- What choices change a mean reversion strategy?
- What should you inspect in a backtest?
- When should you paper trade or go live?
- Turn the idea into a crypto trading bot with Hetty
A sharp BTC selloff can mean two very different things.
It may be a temporary dislocation that gets retraced. Or it may be the first leg of a new trend, where “cheap” keeps getting cheaper.
A mean reversion strategy turns that decision into rules. It defines a reference level, measures how far price has moved from it, enters when the deviation is large enough, and exits when the price returns—or when the reversion thesis is invalidated.
What is mean reversion in crypto?
Mean reversion is the idea that a price, return, or relative spread can move away from a typical level and later move back toward it.
In a crypto mean reversion strategy, the mean is usually a moving reference rather than a permanent value. It might be a rolling average of BTC’s price, the average of a spread between two assets, or another level defined by the strategy.
The trade is not “the price fell, so it must rise.” It is:
define what normal means,
measure an unusual deviation from that reference,
enter only when the deviation reaches the rule’s threshold,
leave when the reference is reached or the reversion thesis fails.
That makes the idea testable. It also makes the assumption visible.
For a broader comparison of strategy families, see our Bitcoin trading strategies guide.
Why might a price return toward its mean?
Several mechanisms can produce a temporary move. A news reaction can overshoot the information it contains. A one-sided order imbalance can push price away from where liquidity is available. Leverage can turn a small move into a liquidation cascade, followed by a partial recovery.
These are possible explanations, not a permanent property of crypto markets. De Bondt and Thaler’s classic overreaction study found historical reversal in portfolios of prior stock-market losers. Poterba and Summers’ variance-ratio study also examined transitory components and long-horizon reversal in stock prices.
The evidence does not tell you that BTC will revert over your chosen lookback. It tells you that temporary deviations are a reasonable hypothesis to investigate.
Crypto-specific results are mixed for the same reason. One study of 200 cryptocurrencies reported daily, weekly, and monthly return reversals, with stronger effects in smaller and less liquid assets (Kozlowski, Puleo, and Zhou). An intraday study of Bitcoin found negative return autocorrelation at one-, two-, and four-hour horizons (De Nicola). Other work finds persistent shocks and little mean reversion in Bitcoin’s price level (Bouri et al.).
The useful question is therefore specific: does this asset revert at this horizon, under these market conditions, after costs?
Three ways to define the mean
1. A rolling mean for one asset
The simplest version compares BTC with its recent moving average. A 20-period simple moving average asks where the center of the last 20 observations was; it does not claim that center is fair value.
This is the family of rules often expressed with moving averages, Bollinger Bands, or an RSI oversold reading. The indicator measures distance or recent speed. It does not decide by itself whether the deviation is temporary.
2. A volatility-normalized deviation
The same price distance can be ordinary in a volatile week and extreme in a quiet week. A z-score puts the distance in units of recent standard deviation:
z-score = (price − rolling mean) / rolling standard deviation
A rule such as “enter at z ≤ −2 and exit at z ≥ 0” is easier to compare across periods than a fixed dollar distance. The threshold is still a design choice, not a probability that the price will return.
3. A relative spread between two assets
Pairs trading does not require either asset to return to its own average. It trades a spread—often a hedged combination of two related assets—when that spread becomes unusually wide.
The classic Gatev, Goetzmann, and Rouwenhorst study tested a rules-based pairs trade and found that its behavior was different from simply buying recent losers. A crypto pair needs the same discipline: estimate the hedge relationship without looking into the future, check whether the spread is stable enough to model, and define what happens if the relationship breaks.
A Bitcoin mean reversion strategy using a rolling z-score
Here is a complete example for a BTC spot bot. The numbers are illustrative so that every decision can be tested; they are not recommended settings or a performance claim.
Decision | Illustrative rule |
|---|---|
Market | BTC spot on one selected exchange |
Evaluation | Once per completed daily candle, using UTC days |
Reference | Mean and standard deviation of the previous 20 completed candles; exclude today’s candle |
Entry | When flat, buy after today’s close produces a z-score at or below −2 |
Exit | Sell when a later close returns to the rolling mean |
Invalidation | Close 1.5 ATR below the entry price, or ten daily bars pass without reversion |
Sizing | Risk a fixed cash amount per trade; no additional buys while the position is losing |
The sequence matters. The reference window is formed from data that existed before the evaluated close. The signal is then available after that candle completes, and an order is submitted. The fill is not guaranteed to equal the close or the moving average.
This rule expresses one narrow idea: an unusually low BTC close may recover toward its recent center before the position is stopped or times out. Changing the window, threshold, exit, or sizing creates a different strategy.
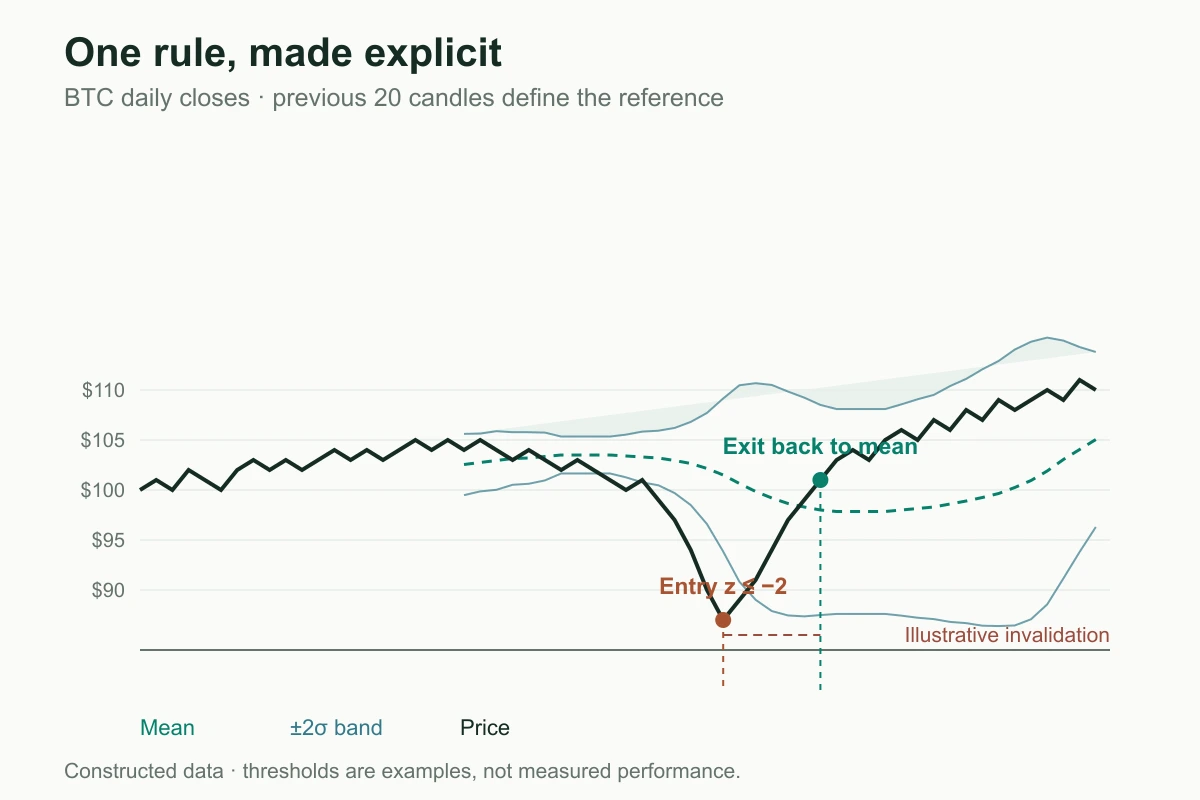
Constructed BTC daily closes. The signal and thresholds illustrate the rule; they are not a backtest or a return forecast.
Three paths after the same entry
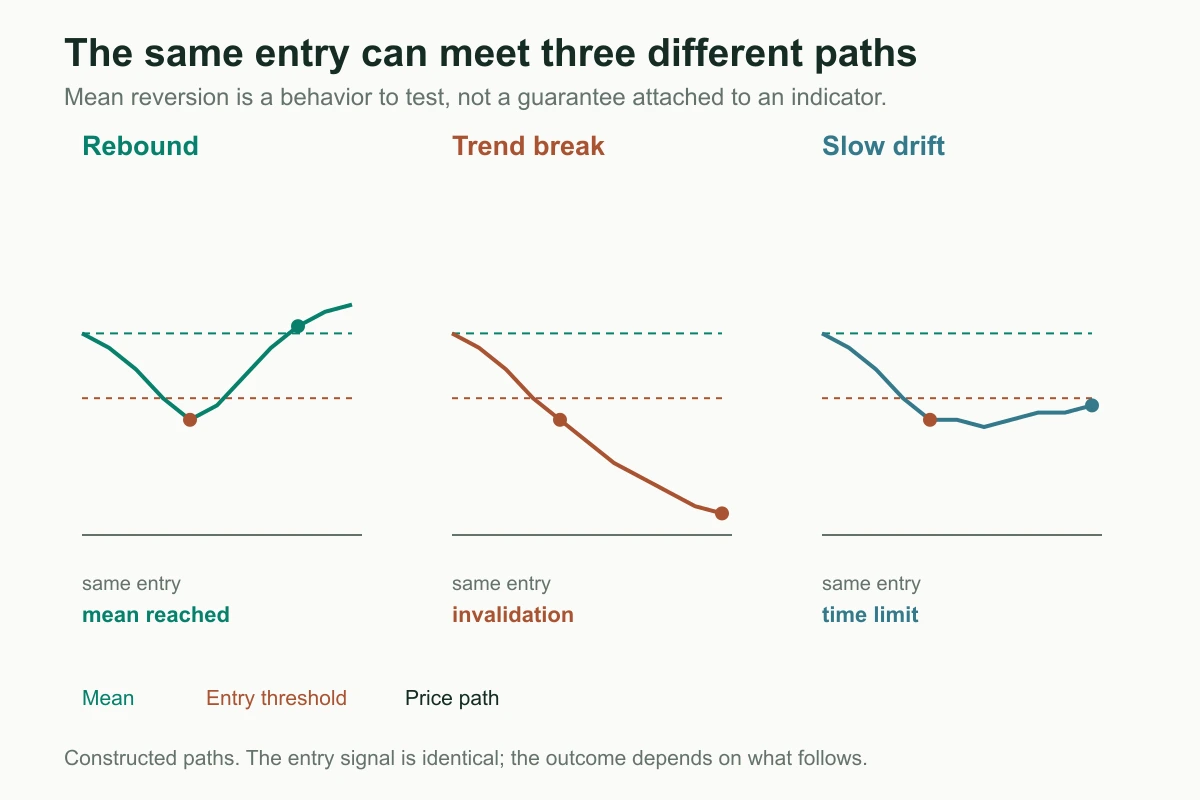
Constructed paths. The entry signal is identical; the outcome depends on what follows.
The rebound
BTC closes below the lower threshold, then moves back toward the rolling mean. The mean exit closes the position after the expected behavior occurs.
The trend break
BTC keeps falling because the move reflects new information or a wider risk-off regime. The price can remain below the rolling mean for much longer than the strategy’s holding period. The invalidation rule exists for this path.
The slow drift
BTC moves sideways but never reaches the exit. Capital remains tied up, fees accumulate, and a strategy can look safe while producing little useful return. A maximum holding time makes this outcome visible instead of leaving it implicit.
The second and third paths are why “price below the average” is not enough. Mean reversion earns its edge only when the return happens before the costs, risk limit, or expiry of the trade.
What choices change a mean reversion strategy?
Lookback window
A short window follows the current market more closely but can treat ordinary noise as an extreme. A long window is steadier but can react slowly when the regime changes. Compare nearby windows rather than choosing the one with the best historical result.
Entry threshold
A mild threshold creates more signals and may enter before the move is truly stretched. A severe threshold creates fewer trades and can miss most of a rebound. The threshold changes both the opportunity set and the size of the losing tail.
Exit rule
Exiting at the mean captures a defined reversion. Exiting before the mean may reduce holding time but gives up part of the move. Waiting for a farther target can increase the amount of profit given back when the rebound stalls.
Invalidation and holding time
There is no reliable statistical floor under a single crypto asset. A stop, a maximum holding time, or a regime filter gives the strategy a way to admit that the original assumption may be wrong. The rule should be decided before a losing trade, not improvised after it.
Position size and instrument
Spot avoids liquidation but still carries price risk. A perpetual contract adds leverage, funding, liquidation, and basis risk to the same mean-reversion idea. Size the position for the path you can tolerate, and include fees, spread, and slippage in the test.
What should you inspect in a backtest?
Mean reversion can produce many small winners and a small number of large losses. A win rate or a smooth-looking equity curve does not show the whole trade.
Inspect:
Time to reversion: how long did profitable trades need to reach the mean?
Stop-before-reversion rate: how often did the position fail before the target?
Maximum adverse excursion: how far did price move against each trade before it exited?
Holding time and time underwater: how much capital was tied up while the signal waited?
Loss concentration: did one trend period erase many small gains?
Costs: how much of the gross result disappeared in fees, spread, slippage, or perpetual funding?
Regimes: did the behavior survive both range-bound and directional periods?
Parameter sensitivity: do nearby lookbacks and thresholds behave similarly?
Use data that was available at each decision. A rolling mean must not include the candle that creates the signal, and a pair’s hedge ratio must not be fitted with future observations. The backtesting guide explains the general workflow; the performance review guide shows how to connect the metrics to your own risk tolerance.
Backtesting estimates how the rules behaved on a historical sample. It cannot guarantee that the next deviation will revert.
When should you paper trade or go live?
If the behavior and drawdowns fit your situation, paper trading lets you observe the signal timing, data updates, order handling, and time spent waiting for a reversion. When the remaining questions are narrow enough for your own risk limits, you can decide whether to move to live trading at a size you can tolerate.
There is no universal number of trades or a return threshold that makes a mean reversion strategy ready. The decision depends on what the backtest leaves you willing—and unwilling—to risk.
Turn the idea into a crypto trading bot with Hetty
You can describe the reference, threshold, exit, and invalidation rules in plain English, then inspect the strategy before testing it.
Build a BTC spot mean reversion strategy. Use completed daily candles. Calculate a 20-candle rolling mean and standard deviation from prior candles only. Enter when the current close has a z-score at or below −2. Exit when a later close returns to the mean. Stop at 1.5 ATR below the entry price or after ten daily bars. Use a fixed cash risk per trade and do not add to a losing position. Show me the rules before backtesting.
Mean reversion is a specific claim about how price behaves after an extreme. Write down the reference, the time horizon, and the failure condition before asking a bot to trade it.
One last thing
Was this story helpful?
Your perspective helps us improve our guides.
No sign-in needed. An anonymous session remembers your response on this browser. Privacy
A little more perspective.
Dollar-Cost Averaging in Crypto: How to Build a DCA Strategy
A practical guide to crypto DCA: understand scheduled Bitcoin purchases, compare new income with lump sums, and define a strategy before automating it.

Momentum Trading in Crypto: How to Build a Strategy
Why buy after a move begins? Follow a Bitcoin Donchian breakout example through entry, exit, false starts, and the choices that shape your strategy.
Polymarket Trading Strategy: How to Automate It
Combine outside data like weather forecasts or Binance prices with Polymarket order rules—then inspect the generated DSL before running it.