Momentum Trading in Crypto: How to Build a Strategy
Why buy after a move begins? Follow a Bitcoin Donchian breakout example through entry, exit, false starts, and the choices that shape your strategy.
In this story
- What is momentum trading?
- Why might a price move continue?
- Two ways to look for momentum
- How do you measure strength?
- A Bitcoin trading strategy using momentum
- What do these rules feel like to trade?
- Which choices change the strategy most?
- What should you look for in a momentum backtest?
- Is momentum a good fit for you?
- Turn your momentum idea into rules with Hetty
BTC breaks above a range it has traded inside for weeks. By the time you notice, the price has already risen.
You could wait for a pullback. A momentum trader sees another possibility: the move may continue far enough to make an entry worthwhile even after the initial rise.
That is the idea behind momentum trading. In this guide, we will build a Bitcoin trading strategy around that idea: define what counts as strength, how you will enter, and what will make you leave.
What is momentum trading?
Momentum trading uses recent price strength or weakness to guide a position, based on the expectation that some moves will continue.
A long momentum strategy buys after evidence of strength appears. Depending on its design, it may hold while that strength persists and exit when the signal weakens or reverses.
The signal naturally arrives after part of the move has happened. The strategy aims to participate in the continuation, accepting that it will usually miss the beginning and give back some gains before an exit.
For a long-only crypto strategy, a weak signal can mean holding cash. Trading a downward move with a short position is a separate choice involving different instruments, costs, and risks.
Why might a price move continue?
Market participants do not all respond at once. Investors may interpret information at different speeds, build positions over several days, or increase their attention as a move develops. These are plausible reasons for buying or selling pressure to persist; they do not explain every rally.
Momentum also has a substantial research history. Moskowitz, Ooi, and Pedersen documented predictability from an instrument’s own past returns across futures and forward markets in Time Series Momentum. Liu and Tsyvinski reported a time-series momentum effect in their historical cryptocurrency sample in Risks and Returns of Cryptocurrency.
That evidence makes continuation worth investigating. It does not establish that a particular coin, indicator setting, or trading horizon offers an opportunity today. Your rules determine which version of the idea you are actually testing.
Two ways to look for momentum
Momentum can mean comparing an asset with its own history or comparing it with other assets.
Approach | Question | Example |
|---|---|---|
Own-history momentum | Has this asset been moving up or down? | Buy BTC when its recent return turns positive under a defined rule |
Relative momentum | Which assets have performed more strongly than the others? | Rank a chosen universe by recent returns and allocate to the strongest assets |
The second approach is often called relative strength or cross-sectional momentum. Ranking assets also requires decisions about the eligible universe, allocation, and how often to rebalance.
The strongest asset in a ranking can still be falling. If every coin lost value, the top-ranked one may simply have fallen least. You can add a positive-momentum requirement if you want the strategy to hold cash in that situation.
For this article, we will follow one asset’s price and build a BTC spot strategy.
How do you measure strength?
Several familiar rules express the idea in different ways:
Lookback return or rate of change (ROC): compare the current price with its price a specified number of periods earlier.
Moving-average signals: compare price with an average, or a faster average with a slower one, to describe the direction of the trend.
Price breakouts: look for a move beyond a previously defined range or high.
These measurements can disagree because they ask different questions. BTC can be above its long-term average while falling over the last few days. A new short-term high can occur while a longer-term return remains negative.
Choose the measure and horizon that match the behavior you want to trade. Then add the position and exit rules that make it a complete strategy.
A Bitcoin trading strategy using momentum
Suppose your idea is that a move above the previous 20 days’ highs may develop into a sustained rise.
This Bitcoin breakout strategy is one way to express momentum. For a wider comparison, see our Bitcoin trading strategies guide.
This is a Donchian Channel breakout approach: the boundaries come from earlier price highs and lows. Channel breakouts also underpin Turtle Trading; our example uses daily-close confirmation and simple sizing rather than the full original system.
Here is one way to specify it:
Decision | Illustrative rule |
|---|---|
Market | BTC spot on one selected exchange |
Evaluation | Once per completed daily candle, using UTC days |
Entry | When flat, buy if the daily close exceeds the highest high of the previous 20 daily candles |
Exit | When holding, sell if the daily close falls below the lowest low of the previous 10 daily candles |
Allocation | Budget 10% of available cash for a new entry, including fees |
Position behavior | One position at a time; no additional buys while holding and no duplicate orders while one is pending |
Execution | Submit a market order after the closing signal is available |
Both comparison windows exclude the candle being evaluated. The entry level comes from the prior 20 candles; today’s close is then compared with that level.
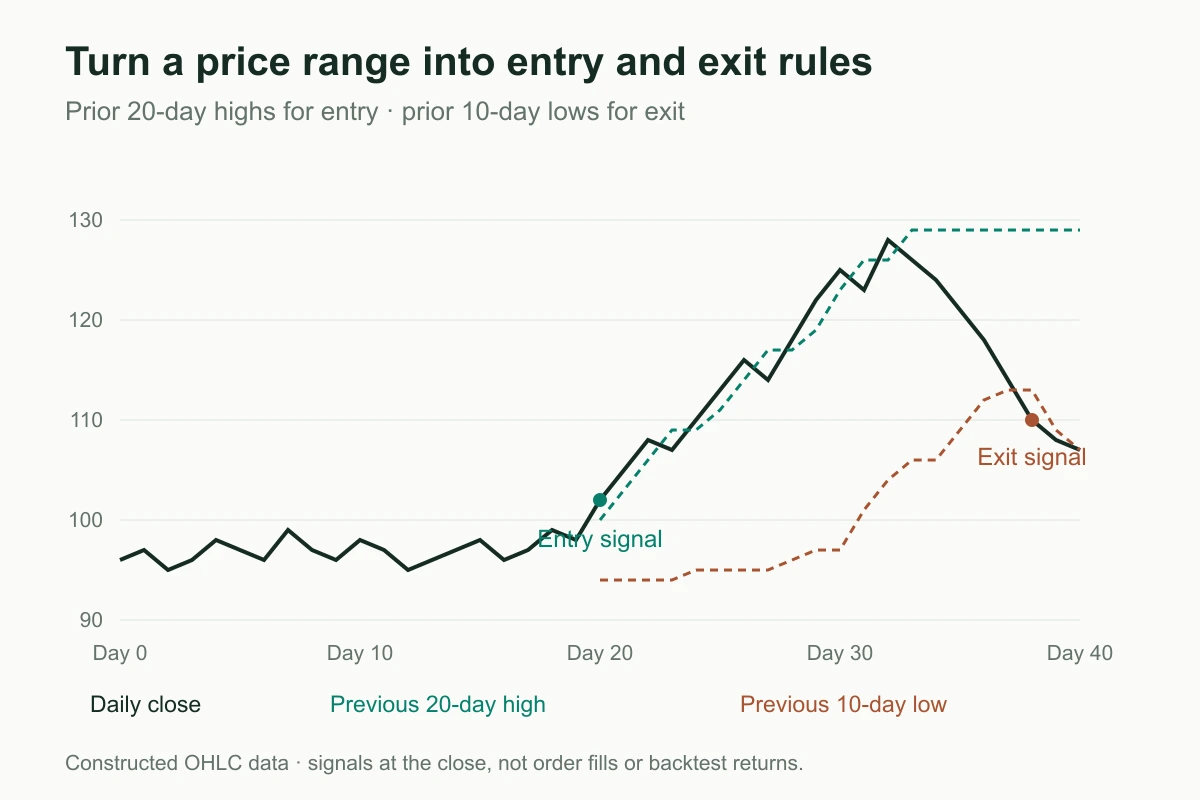
Constructed price data showing the rules. Markers identify closing signals, not order fills or measured strategy returns.
These settings illustrate a strategy to explore. We have not run this example as a backtest or selected the window lengths for their performance. The 10% allocation describes capital committed, not a guaranteed maximum loss percentage.
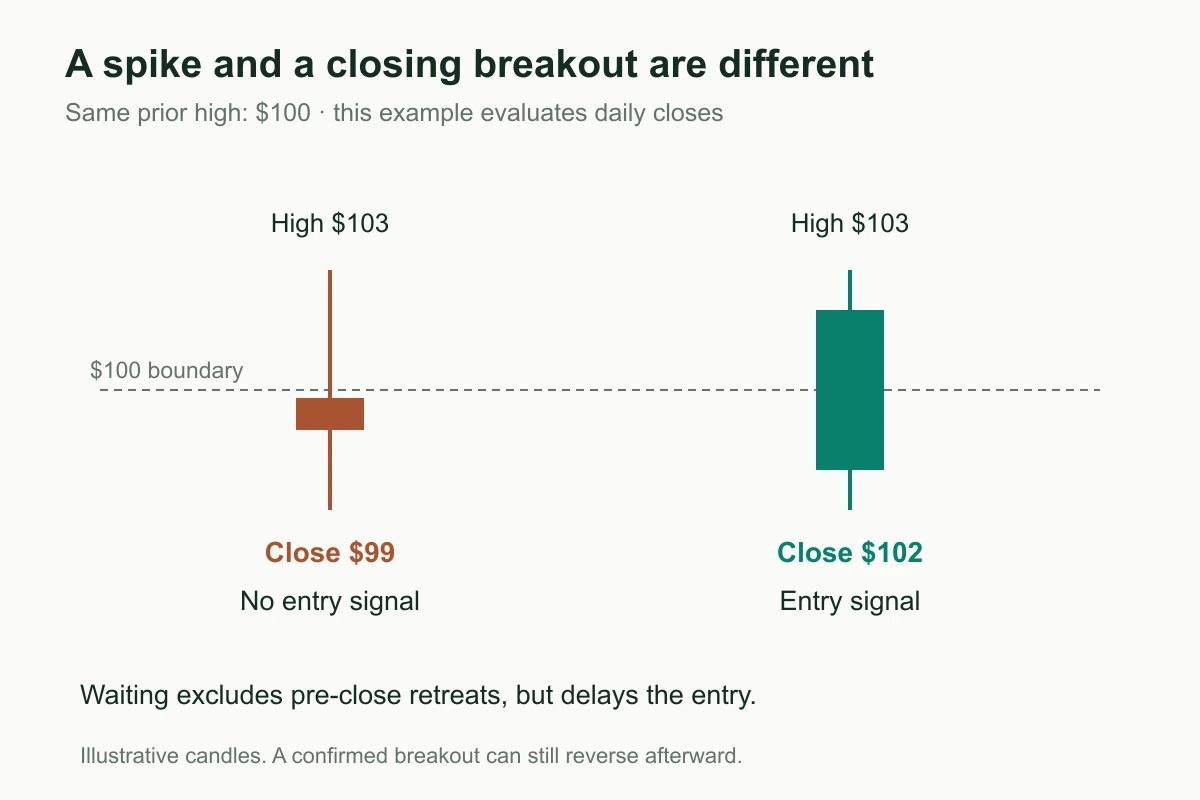
Imagine the previous 20-day high is $100 in a simplified price series. A daily close at $102 meets the entry condition. A brief trade at $102 followed by a close at $99 does not.
Waiting for the completed candle excludes spikes that retreat below the boundary before the close. The trade-off is a later entry, potentially at a higher price; a breakout can still reverse after confirmation.
Once the position is open, further qualifying highs do not create more purchases. The bot watches for the exit rule. Actual entry and exit prices depend on the orders’ fills, rather than being guaranteed at the signal levels.
What do these rules feel like to trade?
The same strategy behaves differently depending on the price path that follows the entry.
The move continues
After the breakout, price continues rising and stays above the exit boundary. The strategy holds through fluctuations that do not trigger its exit.
The opportunity comes from letting the position participate in a longer move. Taking profit very quickly would change that payoff: it could bank a gain sooner while cutting off the continuation the strategy was designed to capture.
The breakout fails
Price closes above the entry boundary, then falls back. The strategy remains exposed until its exit condition occurs, potentially closing at a loss.
In a sideways market, this can repeat: enter on apparent strength, exit after weakness, and pay costs each time. These false starts are an important part of the experience to examine in a backtest.
Repeated reversals around a signal are often called whipsaws. Close confirmation changes which signals qualify, but it does not eliminate this pattern.
A profitable move reverses
The position gains value, reaches a peak, and then declines far enough to trigger the exit. Some unrealized profit disappears before the trade closes.
Waiting for a trend-based exit means accepting that the highest price was only identifiable afterward. The decision is how much room your rules give the position to fluctuate before you leave.
Which choices change the strategy most?
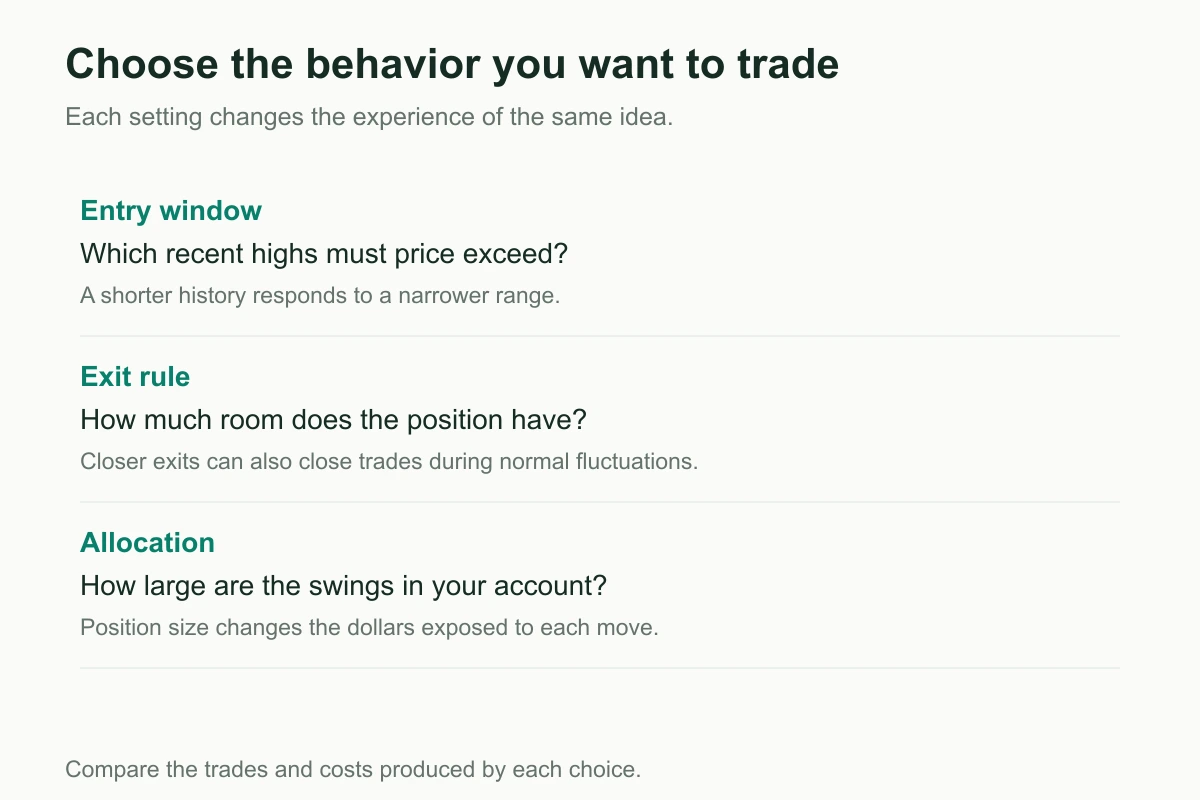
The lookback period
A shorter entry window responds to more recent price action. A longer window asks price to clear a broader historical range.
That changes entry timing and which moves qualify. It can also change turnover and false starts. Compare the resulting behavior and costs instead of assuming the faster signal is better.
The exit rule
Our example uses a shorter channel for exits than entries. You could investigate a different exit window, a moving-average exit, or a trailing stop.
An exit closer to the current price can reduce the room for a reversal, but it may also close positions during ordinary fluctuations. An exit farther away gives the trade more room and can allow larger losses or profit giveback. A stop trigger still does not guarantee a particular fill price.
The allocation
Using a fixed share of cash is simple, but the same dollar position can have very different swings in calm and volatile markets. Adjust the size to the exposure you can tolerate; volatility-based sizing is another approach to explore as the strategy develops.
If you expand to several coins, inspect their combined exposure. Multiple positions can all respond to the same crypto market move.
Additional confirmation
Volume, a longer-term trend filter, or a second condition can change which breakouts you trade. Each filter also excludes opportunities and adds another research choice.
Give it a clear purpose. For example, “I want to avoid entering against a longer-term decline” is something you can investigate. Compare what the filter removes as well as what it improves.
What should you look for in a momentum backtest?
Start with the trades: did entries occur after the defined signal, and did positions remain open until the intended exit?
Then focus on questions specific to continuation strategies:
How much of the move remained after entry? A chart can show a strong trend even if your rule entered too late to benefit.
What did the false starts cost? Examine losing trades, turnover, and fees in sideways periods.
How important were the largest winners? A few sustained moves may contribute much of the profit. Inspect whether the strategy could stay in those trades and how long it waited for them.
What did the exit give back? Compare the account’s peaks and drawdowns with the periods you would have needed to hold through.
What happened while it held cash? Compare with buy-and-hold over the same dates, considering return and exposure together.
How dependent was the result on the settings or period? Examine nearby choices and observations that did not help select the strategy.
A low win rate does not by itself rule out a momentum strategy, and a high win rate does not establish profitability. The size and distribution of wins and losses determine the result after costs. Our guide to reading backtest results shows how to connect those numbers to your own capital and risk tolerance.
Is momentum a good fit for you?
Momentum may suit you if you are comfortable buying after strength appears, taking failed signals, and allowing a profitable position some room to fluctuate.
If you prefer buying after a decline and looking for a rebound, mean reversion addresses a different idea. The useful distinction is the behavior you expect after entry: continuation or a move back toward a reference level.
When the tested behavior fits your situation well enough to explore further, paper trading can help you observe the rules on new data. You can then decide whether to move to live trading at an allocation you are comfortable with, reviewing the results and adjustments as it runs.
Turn your momentum idea into rules with Hetty
Momentum can be expressed through a single-asset signal, a breakout, a ranking across assets, or a combination of conditions. A trading bot can monitor and execute the rules you choose.
With HeyTraders, bring that idea to Hetty, inspect the strategy it creates, and backtest its behavior.
Help me build a BTC spot momentum strategy. Check completed daily candles: enter above the previous 20 days’ highs and exit below the previous 10 days’ lows, excluding today from both windows. Use a 10% cash budget per entry and one position at a time. Show me the rules before we test it.
Start with the move you want to capture, and decide what would make you leave. Those choices give you a momentum strategy you can examine and develop.
One last thing
Was this story helpful?
Your perspective helps us improve our guides.
No sign-in needed. An anonymous session remembers your response on this browser. Privacy
A little more perspective.
Dollar-Cost Averaging in Crypto: How to Build a DCA Strategy
A practical guide to crypto DCA: understand scheduled Bitcoin purchases, compare new income with lump sums, and define a strategy before automating it.

Mean Reversion in Crypto: How to Build a Strategy
A practical guide to mean reversion in crypto: define the reference mean, build a BTC example, and test what happens when the rebound never arrives.
Polymarket Trading Strategy: How to Automate It
Combine outside data like weather forecasts or Binance prices with Polymarket order rules—then inspect the generated DSL before running it.